This page provides the compiled information to the public regarding Olivet University's institutional performance and student achievement, including retention rates, graduation rates, and employment rates for graduates of professional programs.
Although Olivet University's mission statement and values doesn't have an emphasis on serving students of specific ethnicity or geographic origin, Olivet's current student body is mainly composed of students from east Asia. Most of them are first generation Christians in their family.
Bachelor's Programs
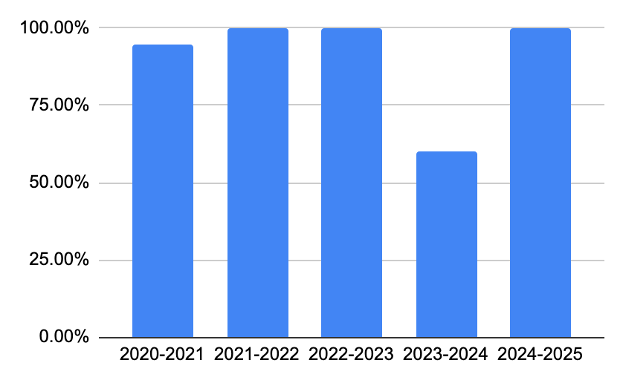
The most recent fall-to-fall retention rate (first year to second year) of Olivet University's Bachelor's programs combined was 100%, and the most recent 3-year average was 93%. This includes both first-time and non-first-time undergraduate students.
Benchmark for Success75%
| Academic Year | Retention Rate | Cohort Size |
|---|
| 2024-2025* | 100% | 9 |
| 2023-2024 | 60% | 5 |
| 2022-2023 | 100% | 15 |
| 2021-2022 | 100% | 5 |
| 2020-2021 | 95% | 19 |
Master's Programs
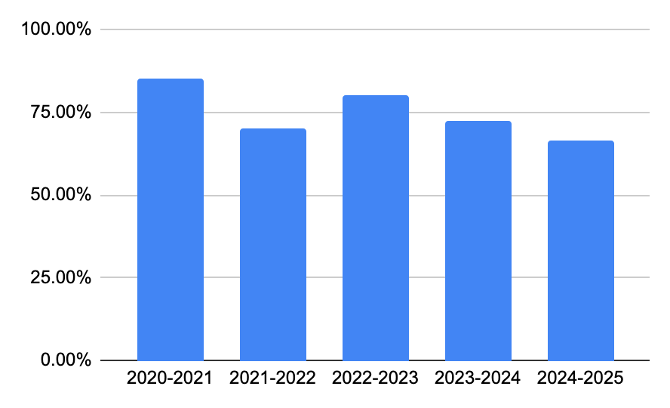
The most recent fall-to-fall retention rate (first year to second year) of Olivet University's Master's programs combined was 67%, and the most recent 3-year average was 71%.
Benchmark for Success65%
| Academic Year | Retention Rate | Cohort Size |
|---|
| 2024-2025* | 67% | 18 |
| 2023-2024 | 72% | 18 |
| 2022-2023 | 80% | 5 |
| 2021-2022 | 70% | 37 |
| 2020-2021 | 85% | 94 |
Doctoral Programs
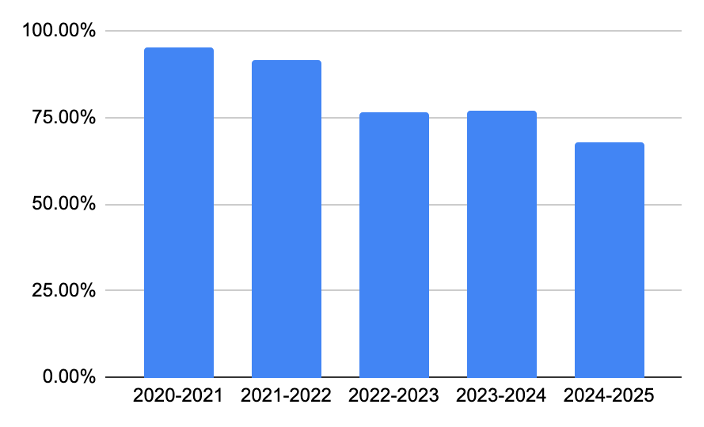
The most recent fall-to-fall retention rate (first year to second year) of Olivet University's Doctoral programs combined was 68%, and the most recent 3-year average was 74%.
Benchmark for Success65%
| Academic Year | Retention Rate | Cohort Size |
|---|
| 2024-2025* | 68% | 25 |
| 2023-2024 | 77% | 13 |
| 2022-2023 | 77% | 30 |
| 2021-2022 | 92% | 36 |
| 2020-2021 | 95% | 43 |
Master of Divinity Program
Doctor of Ministry Program
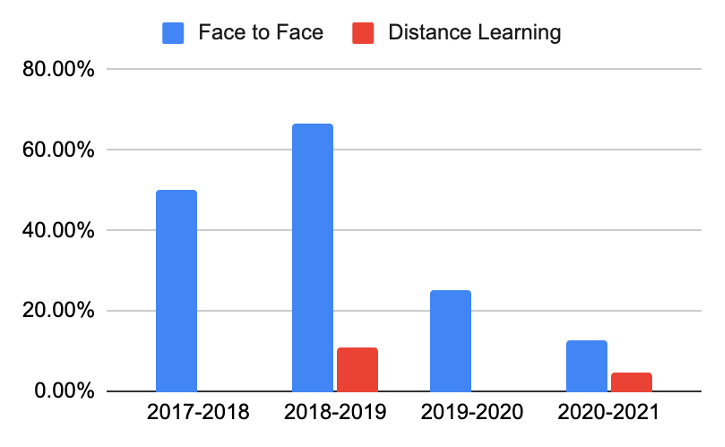
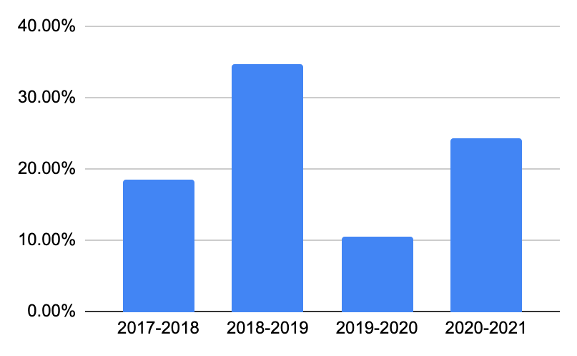
| Entering Year | 100% Grad. Rate | Cohort Size |
|---|
| 2020-2021 | 24.39% | 41 |
| 2019-2020 | 10.53% | 19 |
| 2018-2019 | 34.62% | 26 |
| 2017-2018 | 18.52% | 27 |
Overall
| Graduation Year | Employment Rate | Graduates Available |
|---|
| 2024-2025 | 79.54% | 44 |
| 2023-2024 | 97.22% | 36 |
| 2022-2023 | 71.70% | 53 |
| 2021-2022 | 79.82% | 114 |
Master of Divinity
| Graduation Year | Employed in Field | Graduates Available |
|---|
| 2024-2025 | 39.13% | 23 |
| 2023-2024 | 83.33% | 42 |
Doctor of Ministry
| Graduation Year | Employed in Field | Graduates Available |
|---|
| 2024-2025 | 62.50% | 8 |
| 2023-2024 | 78.57% | 14 |